Our flagship product

Sibilla. Predictive maintenance, asset by asset.

From your plant signals to clear diagnostic indicators, linked to failure modes and fault trees. On-premise or in the cloud.

Reads OPC UA, MQTT, Modbus, SAE J1939 and AVEVA PI.

Diagnostic indicator leaving its expected band The measured value follows the predicted band, then drifts above it. The indicator turns from green to amber when the drift becomes consistent. Simulated data. Sibilla notices time → OK Warning
simulated data

Failures announce themselves. Usually no one is listening.

A degrading bearing changes its vibration weeks before it seizes; a fouling heat exchanger runs a little hotter every day. The signals are often already in the historian or the SCADA, but no one reads them together and in the right context. Sibilla does, asset by asset.

P-F curve The condition of an asset stays steady, then declines faster and faster until functional failure (F). At point P the degradation becomes measurable and Sibilla notices it: the time left until F is the time to plan the intervention. Noise and heat only appear just before F, leaving only time to react. Qualitative, no time scale. condition time failure begins P · Sibilla notices a KDI leaves its band noise and heat: you notice F · failure by ear and touch: time to react with Sibilla: time to plan
Qualitative P-F curve, no time scale: we do not quote lead times without a documented case. The P-F interval comes from reliability-centred maintenance (SAE JA1011, IEC 60300-3-11); the monitoring method from ISO 17359 and ISO 13374. The standards we refer to.

The reliability standards behind it

  • ISO 14224Reliability and maintenance data · the taxonomy of component types and failure modes Sibilla is organised on.
  • IEC 60812FMEA and FMECA · each Blueprint watches a failure mode, with its effects.
  • IEC 61025Fault tree analysis · every signal placed in the fault tree of the asset.
  • SAE JA1011
    IEC 60300-3-11
    Reliability-centred maintenance · the P-F interval, and when condition monitoring is the right strategy.
  • ISO 17359
    ISO 13374
    Condition monitoring · from failure modes to parameters; from data to state, diagnosis and advice.

Standards cited as references for method and vocabulary. Asset management with Sibilla, standard by standard.

What Sibilla does

Six things Sibilla does, each with an example.

Start from what we know about the asset, not from a blank page.

A Blueprint describes how a failure mode is observed on a type of asset: required signals, parameters, the expected degradation pattern (rising trend, residual drift, tracking error, asymmetry, decay rate, flat signal), linked failure modes and suitable analysis engines. It is cloned across many units and adapted to each plant. Today: hundreds of Blueprints for wind, solar and hydro, defined on the fault-tree base and on a taxonomy of 192 component types in the ISO 14224 style.

Example. The “generator bearings” Blueprint of a wind turbine already knows which temperatures are needed, against which load and ambient conditions, and what the expected degradation looks like. Applying it to fifty turbines takes tag mapping, not fifty projects.

Pumps, engines, compressors and other industrial machines: the same analysis engines and the Blueprint wizard build their Blueprint on your data, as a project.

Tell an emergency from a manageable risk.

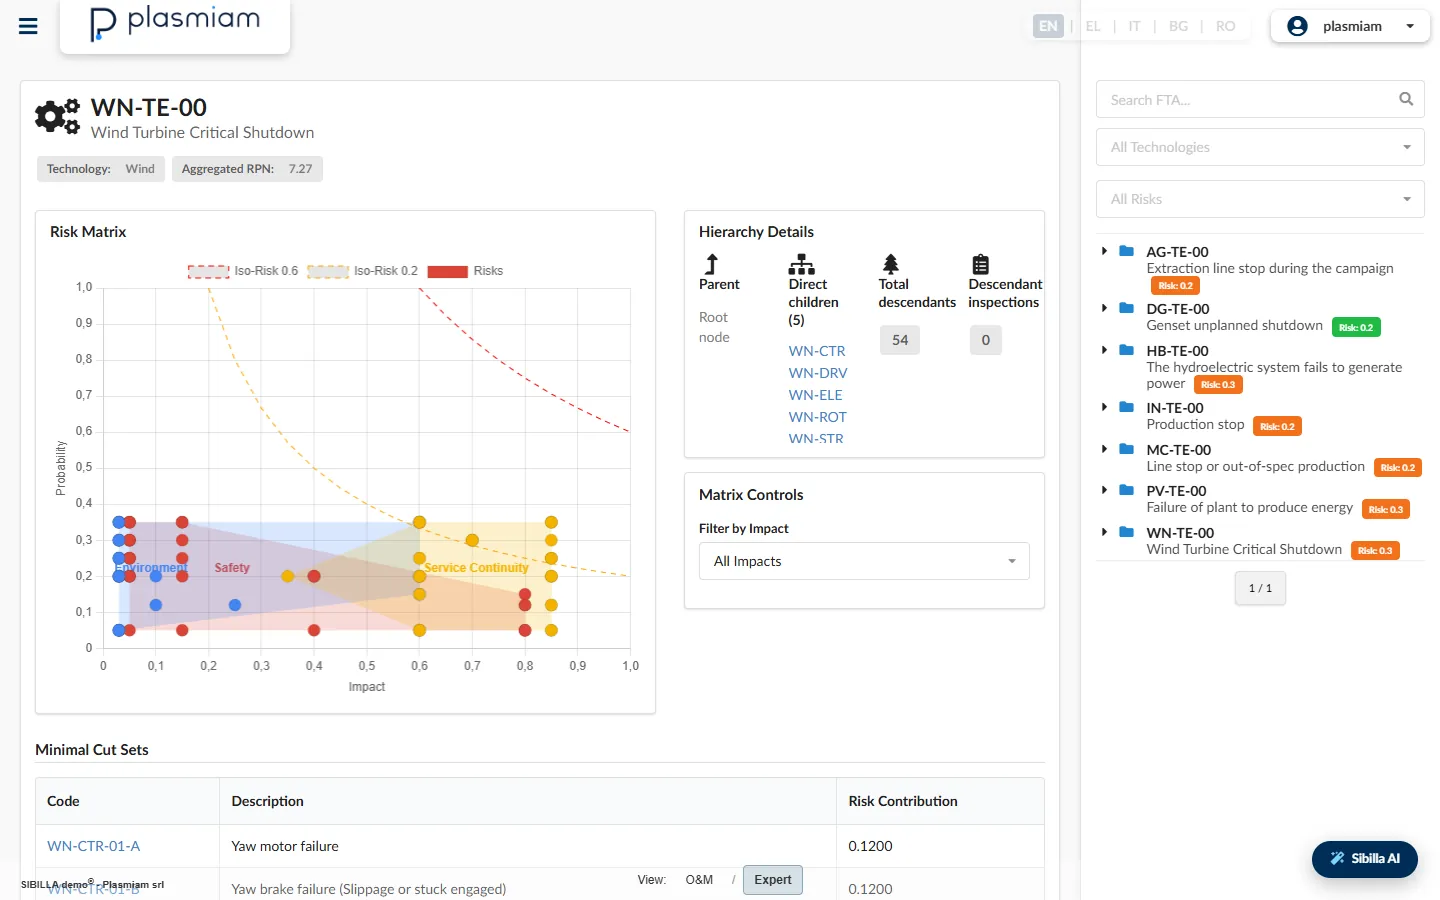
Every degradation signal is linked to its failure mode and to the asset's fault tree (271 failure nodes in the catalogue). Risk matrices weigh safety, environment and continuity of service; minimal cut sets show which basic events lead to system failure.

Example (illustrative). On a hydro unit, the temperature of a guide bearing rises out of its band. Sibilla shows which failure mode it relates to, where it sits in the tree up to the unit trip, and its weight on safety, environment and continuity.

From algorithms to a traffic light any maintainer understands.

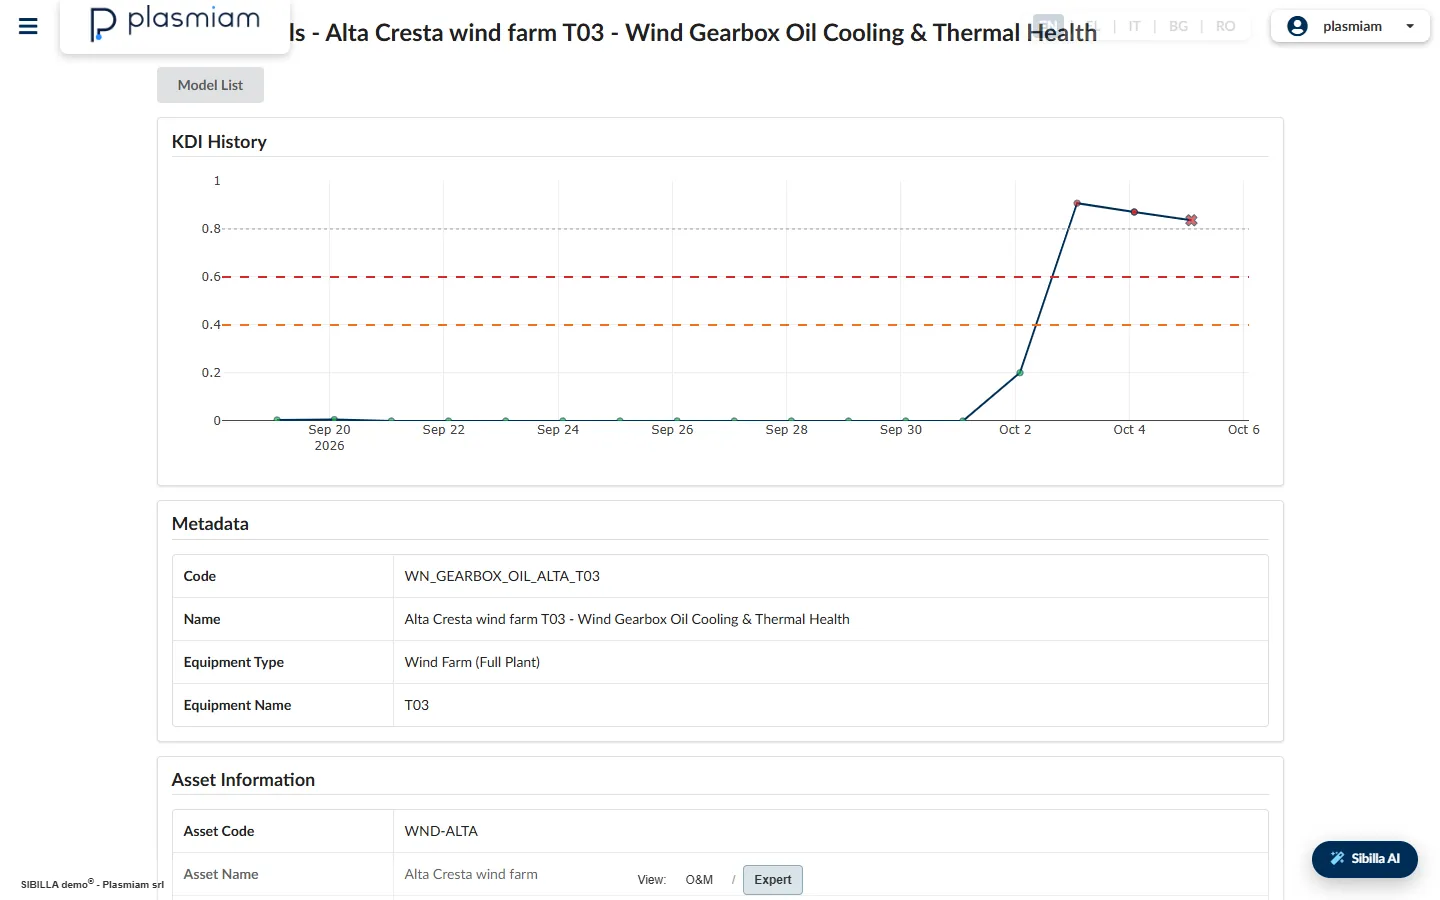
Key Diagnostic Indicators (KDIs) turn model results into a green, amber or red state for each model, with interactive history, predicted versus actual values, confidence bands, a similarity score to the expected degradation pattern and a log of every run.

Example (illustrative, simulated data). A turbine gearbox turns amber. Open the history: the oil temperature has been outside its predicted band for ten days, at the same wind and power.

The right model for each signal. And data you can trust.

A catalogue of 14 analysis engines, from statistical models to deep learning, validated before field use: in the field we only run what has passed validation (today regression, baseline departure and peer comparison between twin units). Every model reports confidence bands and error metrics. Before the models, the Data Quality dashboard checks every measurement point: missing, frozen, duplicated or out-of-range data.

Example. A “frozen” temperature sensor on an inverter has returned the same value for three days. Sibilla flags it as a data problem, not a failure, and avoids a false alarm.

Every alarm leads to an informed decision.

The predictive maintenance loop: acquisition → data quality → models → KDI → failure mode and risk → the expert's decision. The worst state among an asset's models feeds the Asset Health dashboard and the event calendar.

Example. A bearing KDI turns red; the asset page shows the linked failure mode, the out-of-band signals and the risk. The maintenance lead decides the inspection.

  • Available KDI, fault trees, Asset Health
  • Project-based Inspections suggested from the fault tree; opening notifications in your CMMS/ERP (SAP PM and others)

AI explains, the expert decides.

Sibilla exposes its functions through a REST API and an MCP server, so an AI assistant can read results already computed and describe them in plain words (why the KDI is amber, which signals weighed most, what to check). Detection stays deterministic and verifiable; the AI explains, it does not decide.

Example (illustrative). “Why has the generator bearing been amber since Tuesday?” → an answer naming the signals that contributed most, with links to the charts.

Available

Inside Sibilla 2.0

What your team works with every day.

Sibilla 2.0: KDI and confidence bands
Every model as a green, amber or red indicator, with predicted versus actual values. · simulated data
Sibilla 2.0: Fault tree and risk
Each degradation signal linked to its failure mode and to the fault tree of the asset. · simulated data
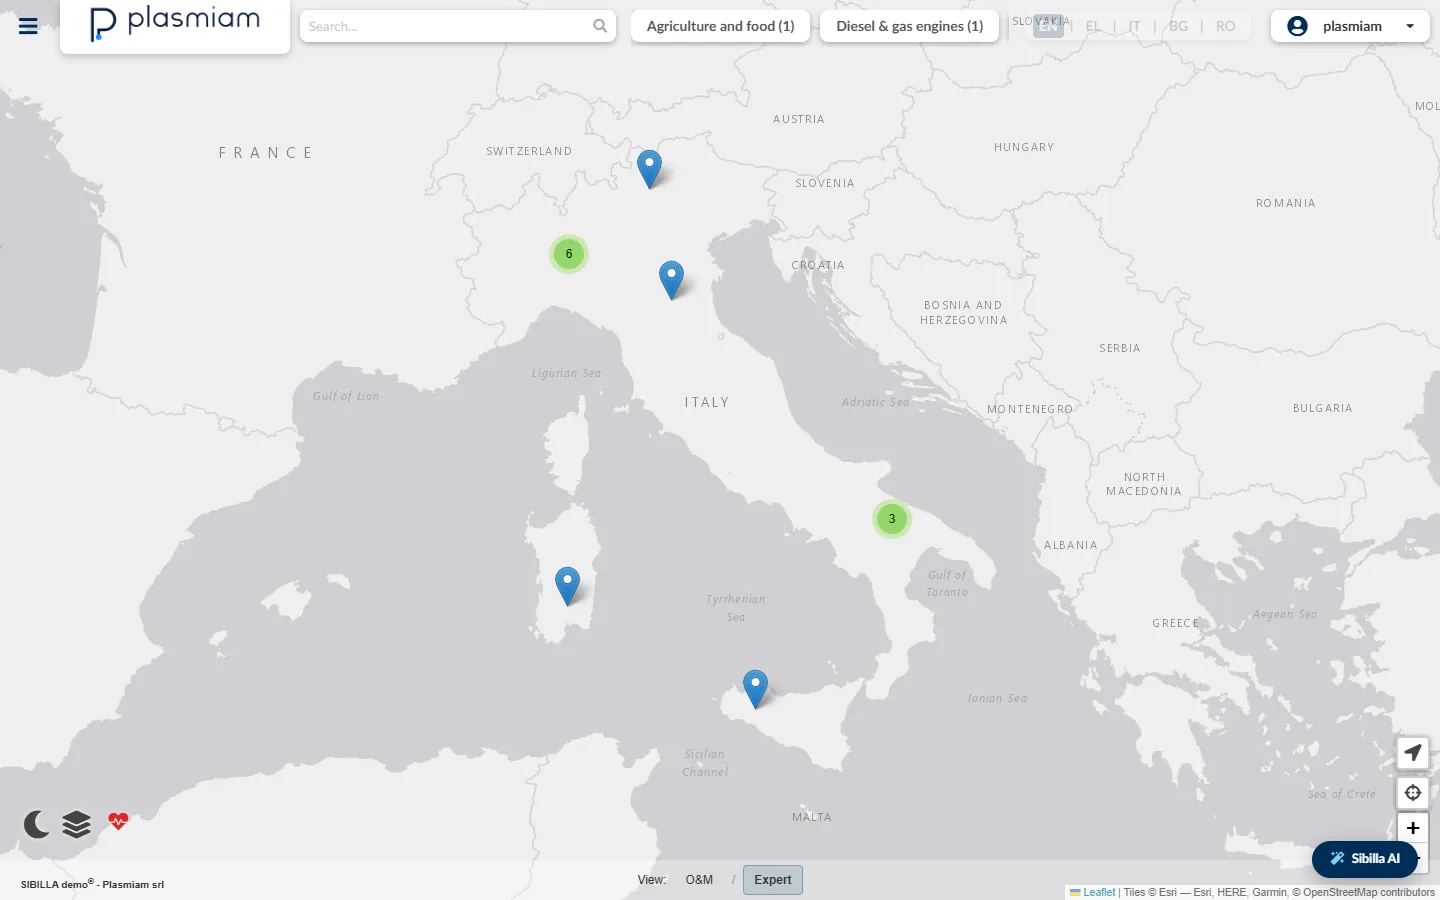
Sibilla 2.0: Fleet map
All sites on one map, with the KDI state of every asset. · simulated data
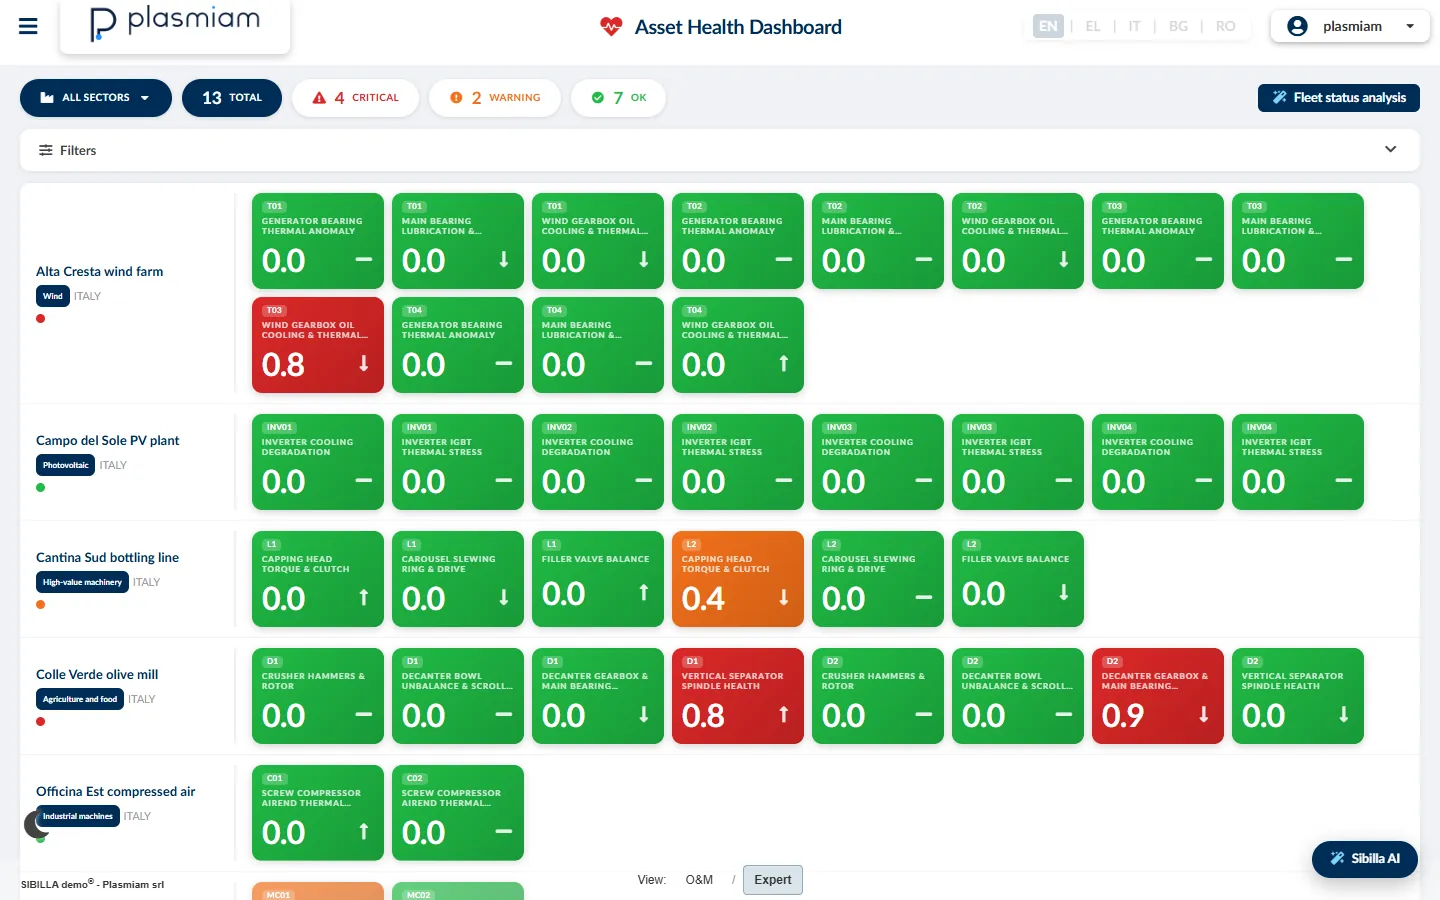
Sibilla 2.0: Asset Health
The simplified view for the maintenance team: a traffic light and one clear sentence. · simulated data

From a single component to all your sites.

The fleet map shows your assets with clustered markers, a day/night layer and KDI state in pop-ups: if you run plants in several countries, you see at once where to look.

Why Sibilla

Multi-brand, asset-specific, yours.

Two typical alternatives, and what changes.

Manufacturer platformsEnterprise cloud suites (SaaS)Sibilla
CoverageMachines of their own brandMany assets, with generic anomaly modelsEvery asset in the plant, from any manufacturer
Failure knowledgeDeep, but only on their own productOften anomalies without a failure modeBlueprints and fault trees per asset type
Where data livesIn the manufacturer's cloud, often tied to the service contractIn the vendor's cloudOn-premise, Docker or cloud: you decide
Getting startedIncluded in the service contractLong projects, heavy configurationReady Blueprints (wind, solar, hydro); start with a pilot on a few assets
SensorsThe manufacturer's ownTo be integrated separatelyTeneuro for vibration and sound, at low cost

Manufacturer platforms remain useful: if their data reaches a historian (AVEVA PI: native) or is exposed via OPC UA (native), Sibilla reads it and puts it next to the rest of the plant; closed manufacturer clouds are connected on a project basis.

On-premise, in Docker or in the cloud. Your data stays where you decide.

On-premise

Inside your network, even with no internet access.

Docker

A Docker Compose stack (database, job queues, application, scheduler, reverse proxy) on one of your virtual machines, with a test environment separate from production.

Cloud

On any Docker host in your cloud (Azure, AWS, Google Cloud) or in ours. Reading data already stored in those clouds is a native connector.

Sibilla reads data and does not control your plant: read-only towards the historian, no operational data going out. Viewer, Editor and Superuser roles per organisation, inherited along the organisation tree. Interface in English, Italian, Greek, Bulgarian and Romanian.

Experience

Years inside a major international utility.

Before Plasmiam, our team designed and ran predictive maintenance for a major international utility: more than 1,000 power plants in 22 countries and over 40 GW of installed capacity, starting from hydro. That experience shaped Teneuro, designed, built and patented by Plasmiam to bring vibration monitoring to large fleets of small plants at a low cost per point.

See it on an asset like yours.

We show you the real platform on simulated data for your asset type: fault tree, Blueprints, models, KDIs and data quality. Then, if it makes sense, a pilot on one critical asset, on the data you already have, under NDA, on-premise or in the cloud.

  1. We talk. A 30-minute call about your asset and your systems.
  2. Demo. Sibilla on your asset type, with simulated data.
  3. Pilot. A few assets, your data, clear goals agreed upfront.
Request a demo on your asset

What comes with every installation

Know-how included. Sibilla is not an empty frame to configure.

Every installation ships with the engineering content: a fault-tree base for wind, solar and hydro, hundreds of Blueprints defined on it, and a method to choose and tune them on your plant's data. There is no single recipe: each asset has its own instrumentation, data quality and operating profile, and tuning is an engineering judgement that comes from years of running and maintaining assets. Mathematics and statistics serve one purpose: a result you can act on in the field.

SIBILLA Core — Predictive Models

Available

One model per asset and failure mode. It learns the normal behaviour of a signal from the operating conditions and measures how far the recent behaviour departs from it. Every run is kept in a history, each with its own report.

KDI — Key Diagnostic Indicator

Available

An index from 0 to 1 that says how far the recent behaviour departs from what the model expected. It is read point by point on the chart, so you see when the departure began and whether it is growing.

Blueprint library and onboarding wizard

Available

Hundreds of model templates by technology and component, each linked to the failure modes of the fault-tree base for wind, solar and hydro. A guided procedure applies them to your assets: tag mapping and tuning on the plant's data, not a project per unit.

Engines

Available

Regression on operating conditions, departure from the healthy level, comparison between identical units. The engine is chosen for the signal, with simplicity and explainability first: every indicator traces back to a signal, a failure mode and an action on the plant.

Peer Comparison

Available

Each unit is compared with its twin units at the same instant. Common causes, such as weather or grid curtailments, cancel out; what remains is the unit's own behaviour.

Data Quality

Available

A score per signal for missing, frozen, duplicated and out-of-range data, with the detail behind it. Before trusting a model, you look at the data it learned from.

Data Exploration (Expert view)

Available

Time series, statistics, seasonality, spectrum, correlations and export, for the engineer's own analysis of the plant data.

Fault Tree Analysis

Available

The catalogue of failure modes of each asset, with risk matrix and the linked inspections. It is the base on which priorities are set and on which the Blueprints are defined.

Predictive Events

Available

A calendar of the state changes of the models: what changed, when and on which asset. The place to start the day from.

Asset Health

Available

One card per asset and per model, with the worst state, the trend and the history. The simplified view for the maintenance team: a traffic light and one clear sentence.

Operating filter

Available

Excludes the periods in which the unit is not in service, so a stopped machine does not raise a false alarm and the models learn only from real operation.

Weather

Available

Weather variables as model inputs when plant sensors are missing: ambient temperature, wind, irradiance, from a weather service, one call per site.

Scheduling, languages, O&M and Expert views

Available

Scheduled runs; a multilingual interface; a simple view for the O&M team and a complete one for the engineer, on the same results.

The approach follows established condition monitoring practice: ISO 13374 for the chain from data to advisory, ISO 17359 and ISO 13379-1 for condition monitoring and diagnostics, ISO 7870-2 for control charts. All the standards we refer to.

A fully agentic platform, with the expert in charge.

Sibilla is built to be worked with through AI agents. You interact with them as you would with a seasoned colleague: they draw on an extensive knowledge base of industrial assets and reliability engineering, take on the repetitive work and help you get to the point faster. Decisions stay with the expert, and every action is traceable.

Available

Modules by technology

Six modules for hydro, wind and solar.

Beyond predictive maintenance, Sibilla can plan, optimise and forecast, technology by technology. Each module is available and optional: it is switched on in your installation if you choose it.

Hydro

Hydro Cascade Optimizer

When and how much to generate along a chain of hydro plants.

Available

Combines inflow forecasts, day-ahead and intraday prices and environmental constraints, such as minimum ecological flow and reservoir levels, to plan generation along a cascade, hour by hour and over several days.

Works on

  • Inflow and weather forecasts
  • Market prices
  • Ecological flow and reservoir limits
  • Cascade layout and turbine efficiency

What you get

  • Generation plan per plant
  • Value of the stored water
  • Alerts near environmental limits

Hydro

Transient & Cavitation Guardian

Water hammer, incipient cavitation and rough operating zones.

Available

Reads high-frequency pressure and acoustic signatures to spot water hammer, incipient cavitation, runner fatigue and instability in the rough zones of a turbine, and links start-stop cycles to the wear of mechanical components.

Works on

  • High-frequency pressure and vibration
  • Flow, opening, power and speed
  • Start-stop history and cavitation maps

What you get

  • Cavitation risk per unit
  • Abnormal transients flagged
  • Wear of runner and seals from cycles

Wind

Wake Steering & Yaw Coordination

Yaw coordinated across the farm to reduce wake losses.

Available

Coordinates yaw offsets and the derating of upstream turbines to steer wakes away from the turbines downwind, using a model of the wind flow over the whole farm. No hardware changes.

Works on

  • SCADA data per turbine
  • Met mast or lidar
  • Layout, terrain and power curves

What you get

  • Yaw setpoints per turbine
  • Wake map and losses
  • Gain measured against a baseline

Wind

Drivetrain & Blade Prognostics

Remaining life of bearings, gearboxes and blades, and when to intervene.

Available

Brings together SCADA, gearbox vibration, oil debris analysis and drone inspections to estimate the remaining life of bearings, gearboxes and blades, and plans the intervention in a low-wind window, with time to order the parts.

Works on

  • Vibration from the CMS
  • Oil analysis
  • SCADA and blade inspections

What you get

  • Remaining life per component
  • Health index over time
  • Maintenance calendar in low-wind windows

Solar

Performance & Soiling Analytics

Where the energy goes, string by string, and when to clean.

Available

Compares every string and inverter with a clear-sky model of the site and splits the losses into soiling, shading, mismatch, degradation and clipping. Cleaning is planned on cost against energy lost and forecast rain; hotspots and faulty bypass diodes are found from thermography and I-V curves.

Works on

  • String and inverter data
  • Irradiance and weather
  • Thermography and I-V curves, optional

What you get

  • Performance ratio per string and inverter
  • Losses split by cause
  • Cleaning plan by sector
  • Hotspots on the map

Solar

Hybrid Forecasting & Storage

Solar forecasts and a battery plan that looks after the battery.

Available

Forecasts generation from 15 minutes to 48 hours from satellite, weather models and, optionally, sky cameras. The battery's charge and discharge plan is optimised for peak shaving, curtailment, ramp limits and market arbitrage, taking the battery's state of health into account.

Works on

  • Satellite and weather forecasts
  • Battery data
  • Market prices and grid limits

What you get

  • Probabilistic forecast (P10, P50, P90)
  • Charge and discharge schedule
  • Battery state of health

For inspections, work orders, reliability, spare parts and the rest of asset management: the ten management modules of the suite.

In development

What we are building next.

Announced, not yet available: each card says so. Kairos, the maintenance planner, has its own page.

SIBILLA Kairos

In development

Maintenance planning on operating hours and calendar, from three sources: Sibilla's predictive results, the maintenance history and the maintenance plan in SAP PM. AI models propose when to intervene and what to group in the same stop; the planner decides.

Read more

KTI — Key Trend Indicator

In development

An estimate of the time left before a signal reaches its limit, from the trend measured by the models. It complements the KDI, which says how far the behaviour has departed, with a reading of how fast it is moving.

Notifications and alert workflow

In development

Alerts by e-mail and SMS when a model changes state, with take-over, owner and status until closure. Notifications into SAP PM and other CMMS remain project-based.

External API

In development

Programmatic access to results, events and notifications, so that your own tools and reports read what Sibilla has computed.

Tell us what assets you run. We'll show you how they fail and when you'd notice.

AVEVA PI, SAP and the other names cited are trademarks of their respective owners; they are cited only to describe compatibility.